3 Sample estimates and confidence intervals
3.1 How much caffeine is in your coffee?
The table below contains data on the amount of caffeine in a 16 oz. cup of coffee obtained from various vendors. For context, doses of caffeine over 25 mg are enough to increase anxiety in some people, and doses over 300 to 360 mg are enough to significantly increase heart rate in most people. A can of Red Bull contains 80mg of caffeine.
Use the data on coffee caffeine concentration to answers Questions 1–3
These same data are available in the data folder in your student folder on Koa. You can read them into your R session like this:
# remember to replace `username` with your actual user name!
caf <- read.csv("biol220_class/students/username/data/caffeine.csv")
After reading into R, use those data to answer the following questions.
What is the mean amount of caffeine in the sample of 16 oz. coffees? Round your answer to 2 decimal places. [1 point]
What is the 95% confidence interval for the mean? Use the 2 SE rule and round your answer to 2 decimal places. Report your answer like “lower - upper”. For example, if the confidence interval were -1.11 to 2.22, then I would report “-1.11, - 2.22”. [2 point]
Is the amount of caffeine in a cup of coffee relatively consistent from one vendor to another? To help answer that, calculate the standard deviation of caffeine level and round your answer to 2 decimal places. [1 point]
The table below has data on six 16 oz. cups of Breakfast Blend coffee sampled on six different days from a Starbucks location.
Use the two different caffine datasets to compare caffeine concentrations
The Starbucks data are also available in the data folder in your student folder on Koa. You can read them into your R session like this:
# again, remember to change `username`
bucks <- read.csv("biol220_class/students/username/data/caffeineStarbucks.csv")
Calculate the the 95% confidence interval for the mean using the 2 SE rule for the Starbucks data. Report your answer in the same format as Question 2. [2 point]
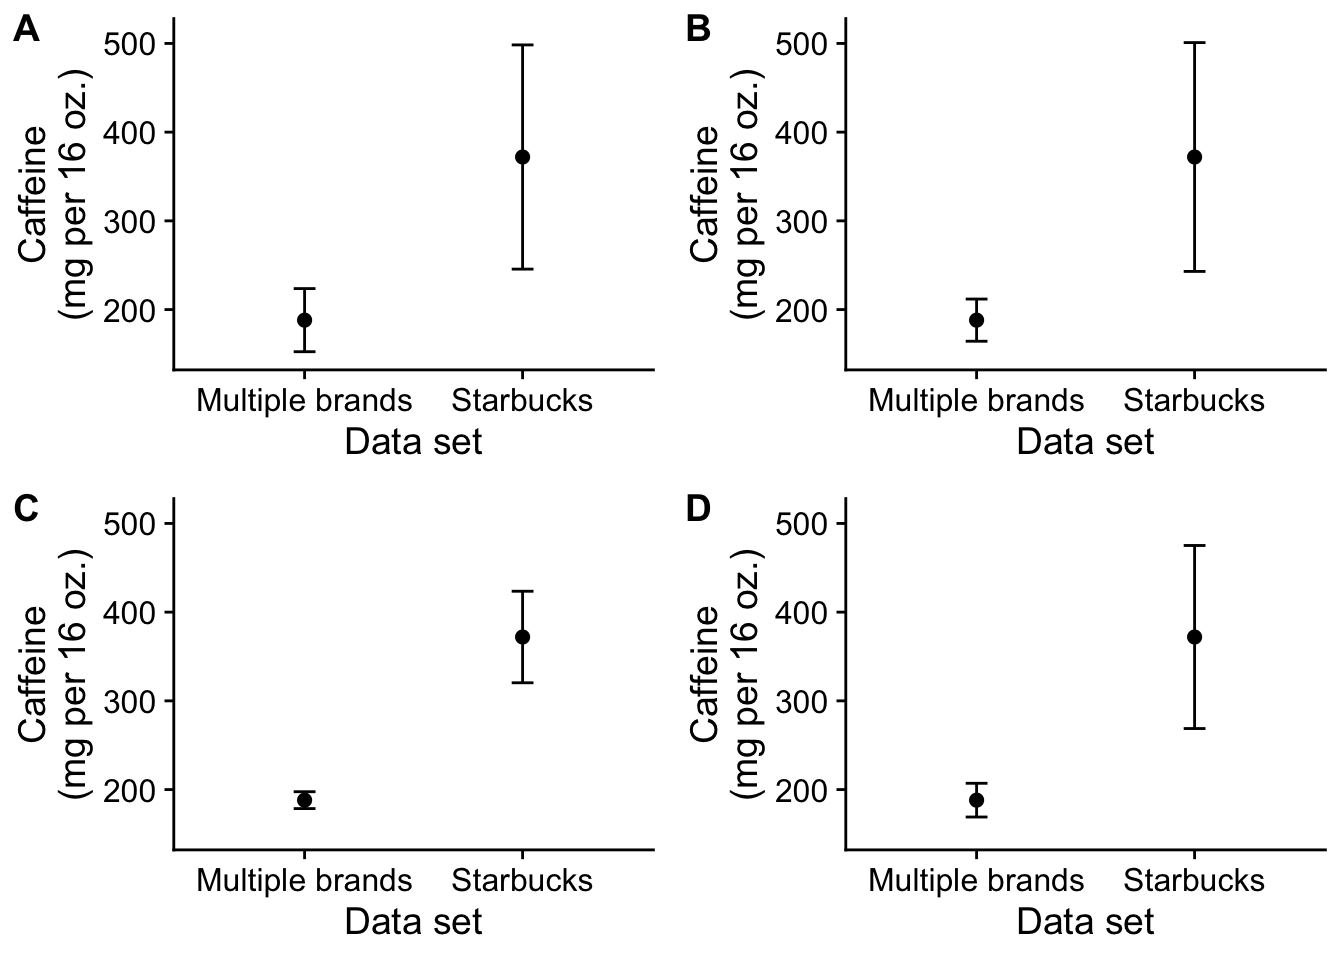
Compare these results to the data taken on the broader sample of vendors in the first datasest. Describe the difference in 1-2 sentences. [2 point]
Based on the two data sets above (Multiple brands and Starbucks), which of the figures below depicts the mean caffeine concentration with error bars equal to \(\pm\) 1 standard error of the mean? [1 point]
3.2 Understanding confidence intervals
The figure below shows sample means (points) and associated confidence intervals of the mean (horizontal lines) from 100 different samples of the same population. In each case, the sample size is exactly \(n = 16\). Assume that all samples were conducted using an identical procedure.
83 of 100 have confidence intervals that overlap the true population mean (vertical black line). These are shown with black points and lines. 17 of 100 have confidence intervals that do not overlap the true population mean (vertical black line). These are shown with red points and lines.
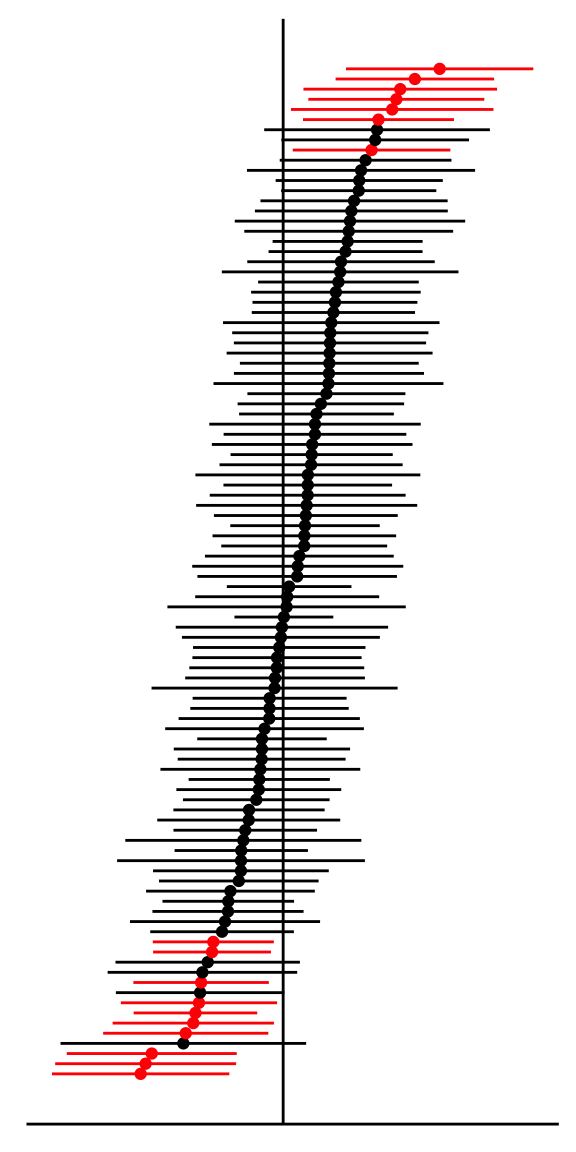
Use the figure above to answer Question 9
- Which of the following statements most likely explains what you observe in this figure? [1 point]
- These are 95% confidence intervals from 100 random samples
- These are 95% confidence intervals from 100 nonrandom samples
- These are 95% confidence intervals but some confidence intervals do not overlap the population mean because the sample size is too small
- These are 95% confidence intervals but some confidence intervals do not overlap the population mean because the samples are biased