10 Regression
Benefits of biodiversity
Just like in the problem set on correlation, we will again look at the data from Fuller et al. (2007) who measured the diversity of plant, bird, and butterfly species in 15 urban green spaces of varying size. They also asked 312 green-space users about their emotional “attachment” to green spaces to see if more biodiverse green space lead to greater emotional attachment from users.
| Attachment | Area (ha) | Number of butterfly species | Number of bird species | ln(Number of plant species) |
|---|---|---|---|---|
| 4.4 | 23.8 | 6 | 12 | 5.1 |
| 4.5 | 16.0 | 14 | 18 | 5.5 |
| 4.7 | 6.9 | 8 | 8 | 6.4 |
| 4.5 | 2.3 | 10 | 17 | 4.7 |
| 4.3 | 5.7 | 6 | 7 | 5.3 |
| 3.8 | 1.2 | 5 | 4 | 4.6 |
| 4.4 | 1.4 | 5 | 8 | 4.5 |
| 4.6 | 15.0 | 7 | 22 | 5.5 |
| 4.1 | 3.1 | 9 | 7 | 5.2 |
| 4.2 | 3.8 | 5 | 4 | 4.6 |
| 4.6 | 7.6 | 10 | 11 | 4.5 |
| 4.2 | 12.9 | 9 | 11 | 5.0 |
| 4.3 | 4.0 | 12 | 13 | 5.0 |
| 4.4 | 5.6 | 11 | 16 | 5.6 |
| 4.2 | 4.9 | 7 | 7 | 5.4 |
Questions 1–5 refer to the prompt and data above
To get these data into R you can copy-paste and run this code:
fuller_etal_2017 <- data.frame(
    attachment = c(4.4, 4.5, 4.7, 4.5, 4.3, 3.8, 4.4, 4.6, 4.1,
                   4.2, 4.6, 4.2, 4.3, 4.4, 4.2),
    area_ha = c(23.8, 16.0, 6.9, 2.3, 5.7, 1.2, 1.4, 15.0, 3.1,
                3.8, 7.6, 12.9, 4.0, 5.6, 4.9),
    butterfly = c(6, 14, 8, 10, 6, 5, 5, 7, 9, 5, 10, 9, 12, 11, 7),
    bird = c(12, 18, 8, 17, 7, 4, 8, 22, 7, 4, 11, 11, 13, 16, 7),
    ln_plant = c(5.1, 5.5, 6.4, 4.7, 5.3, 4.6, 4.5, 5.5, 5.2,
                 4.6, 4.5, 5.0, 5.0, 5.6, 5.4)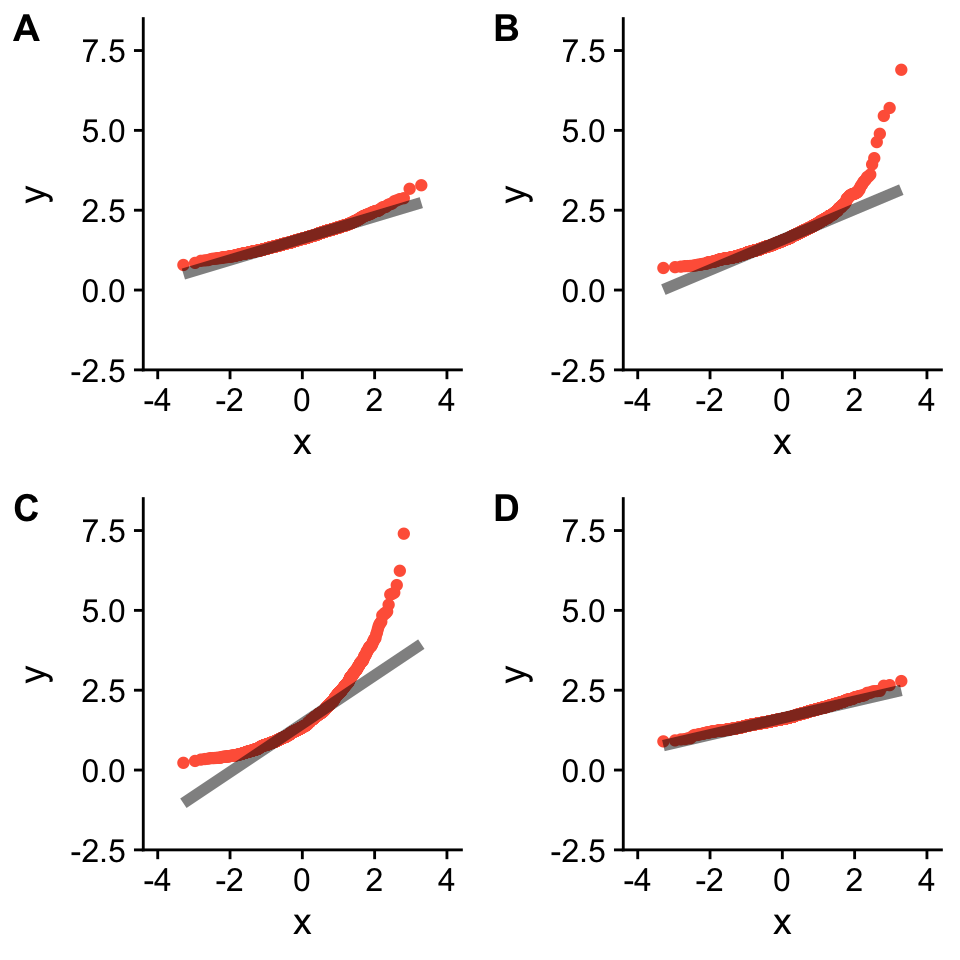
)- If our question is “does greater bird diversity increase attachment?”, which graph below best visualizes the data in a way consistent with this question? [1 point]
If our question is “does greater bird diversity increase attachment?” what is the best null hypothesis in a linear regression framework? [1 point]
- H_0: The slope of (change in bird species richness) versus (change in attachment) is 0
- H_0: The slope of (change in attachment) versus (change in bird species richness) is 0
- H_0: The slope of (change in attachment) versus (change in bird species richness) is not 0
- H_0: The slope of (change in bird species richness) versus (change in attachment) is less than 0
Calculate the estimated slope for each of the following relationships:
- Attachment as predicted by Number of butterfly species [1 point]
- Attachment as predicted by Number of bird species [1 point]
- Attachment as predicted by Area [1 point]
For the linear model predicting Attachment from Number of bird species, report the results for a \(t\)-test null hypothesis test. Specifically, report the \(t\)-statistic, degrees of freedom, and \(P\)-value. [1 point]
Use the
confintfunction to calculate the 95% confidence interval for the slope of Attachment as predicted by Number of bird species. [1 point]Use
ggplotcode to show the data for Attachment as predicted by Number of bird species, the regression line for this relationship, and the 95% confidence band. Copy and paste your code into the google form to answer this question. [1 point]Based on your findings from questions 2–6, do you reject the null hypothesis? What, if any, caveats should you state when interpreting the relationship between Attachment and Number of bird species? [2 points]