9 Correlation
Benefits of biodiversity
Fuller et al. (2007) measured the diversity of plant, bird, and butterfly species in 15 urban green spaces of varying size. They also asked 312 green-space users about their emotional “attachment” to green spaces to see if more biodiverse green space lead to greater emotional attachment from users.
| Attachment | Area (ha) | Number of butterfly species | Number of bird species | ln(Number of plant species) |
|---|---|---|---|---|
| 4.4 | 23.8 | 6 | 12 | 5.1 |
| 4.5 | 16.0 | 14 | 18 | 5.5 |
| 4.7 | 6.9 | 8 | 8 | 6.4 |
| 4.5 | 2.3 | 10 | 17 | 4.7 |
| 4.3 | 5.7 | 6 | 7 | 5.3 |
| 3.8 | 1.2 | 5 | 4 | 4.6 |
| 4.4 | 1.4 | 5 | 8 | 4.5 |
| 4.6 | 15.0 | 7 | 22 | 5.5 |
| 4.1 | 3.1 | 9 | 7 | 5.2 |
| 4.2 | 3.8 | 5 | 4 | 4.6 |
| 4.6 | 7.6 | 10 | 11 | 4.5 |
| 4.2 | 12.9 | 9 | 11 | 5.0 |
| 4.3 | 4.0 | 12 | 13 | 5.0 |
| 4.4 | 5.6 | 11 | 16 | 5.6 |
| 4.2 | 4.9 | 7 | 7 | 5.4 |
Questions 1–5 refer to the prompt and data above
To get these data into R you can copy-paste and run this code:
fuller_etal_2017 <- data.frame(
    attachment = c(4.4, 4.5, 4.7, 4.5, 4.3, 3.8, 4.4, 4.6, 4.1,
                   4.2, 4.6, 4.2, 4.3, 4.4, 4.2),
    area_ha = c(23.8, 16.0, 6.9, 2.3, 5.7, 1.2, 1.4, 15.0, 3.1,
                3.8, 7.6, 12.9, 4.0, 5.6, 4.9),
    butterfly = c(6, 14, 8, 10, 6, 5, 5, 7, 9, 5, 10, 9, 12, 11, 7),
    bird = c(12, 18, 8, 17, 7, 4, 8, 22, 7, 4, 11, 11, 13, 16, 7),
    ln_plant = c(5.1, 5.5, 6.4, 4.7, 5.3, 4.6, 4.5, 5.5, 5.2,
                 4.6, 4.5, 5.0, 5.0, 5.6, 5.4)
)
Calculate the product-moment correlation coefficient for each of the following pairs of numerical variables:
- Attachment and Number of butterfly species [1 point]
- Attachment and Number of bird species [1 point]
- Attachment and ln(Number of plant species) [1 point]
Which measure of biodiversity is most strongly correlated with attachment? [1 point]
Larger green spaces (greater area) might have more species and cause greater emotional attachment. Calculate the correlation between Area (ha) and Attachment. Round your answer to the nearest 0.01. [1 point]
This question refers to Question 3. Using
cor.test, what is the \(P\)-value and 95% CI of the correlation between green space area and attachment? [1 point]This question refers to Questions 3 and 4. Calculate the \(P\)-value for the correlation test “by hand” using the t distribution. To answer this question, paste your code into the google form. [2 point, partial credit will be given]
Your code should show (at a minimum):
- how you calculate the degrees of freedom
- how you use one of the t distribution functions (either
dt,pt,qt, orrt) to calculate the P-value
Visualizing correlation
Suppose that you measure two numerical variables \(X\) and \(Y\). The figure below depicts four possible outcomes.
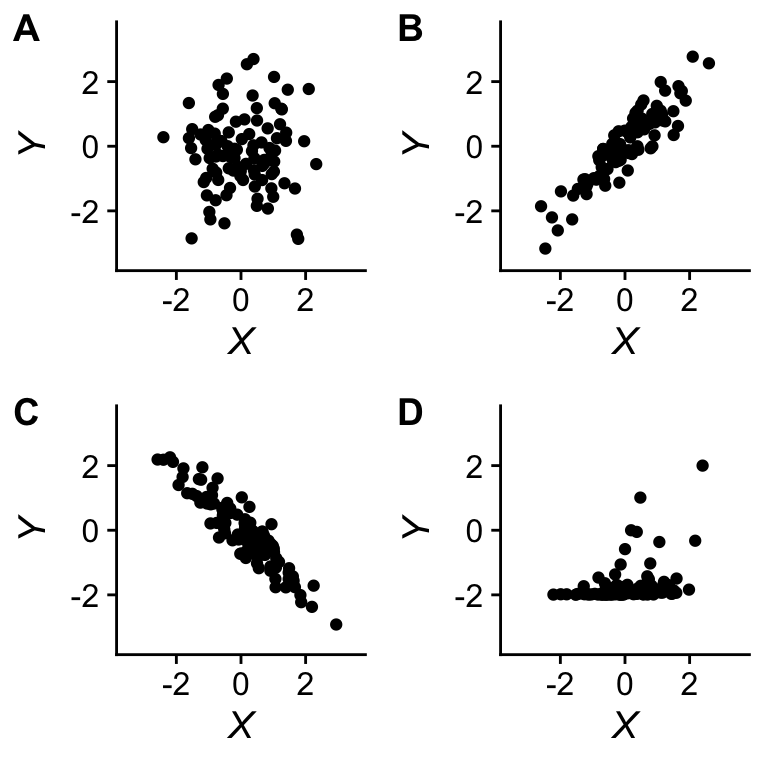
Questions 6–7 refer to the prompt and figure above
Which panel depicts the strongest positive association between \(X\) and \(Y\)? [1 point]
Which panel depicts data that likely violate the assumptions of correlation tests? [1 point]